
We left before dawn on Wednesday morning. After a nearly 4 hour drive, we arrived at the first PIT tag antenna site. The first thing we saw, were a couple of the antennas tied up close to the bank. High flows had occurred throughout the state that past weekend, causing damage and flooding in many areas. The antennas appeared undamaged but were definitely out of place. Courtney quickly loaded updates to the computer and downloaded the PIT tag information onto her thumbdrive. We did this throughout the day, one site to the next. That was the easy day.

After a night in the hotel, we rose once again before dawn, packed up our gear, and headed out to visit a remote site located along the SF Walla Walla River. We knew the hike in was about 4 miles but we didn’t know how much snow or ice would be covering the trail. It was uncertain whether we could even make it to the site safely. There was about an inch of snow at the trailhead, so we donned layers of clothes and loaded up our packs with snowshoes, yaktrax for icy conditions, and an ice axe, in addition to the essentials needed to maintain the site as well as plenty of snacks. George, the gentleman who helps us maintain this site, estimated that it would take a good 2½ to 3 hours to get to our destination.

About 15 minutes into the hike, we soon figured that we would probably not need the snow shoes so we hid them behind some trees, hoping that we were right in our assumption. The trail had patches of ice and snow and was bare under some of the trees. Soon we decided the ice axe could stay behind as well.
Onward we went. The first neat thing we saw were some tracks. Not just any tracks though. These appeared to be Big Dog tracks or wolf. Seeing that there were no human prints around, we think they were wolf tracks. Wolf have been spotted just 70 miles from where we were so it was not too far fetched to believe that these were indeed the tracks of wolves. That was exciting for me. We followed the tracks for some time and I was happy that we were following the animal who was making the tracks and not the other way around.

At one point, we detected a rancid, decaying odor. As it got stronger, we looked off the trail towards the river and saw an elk carcass covered with tree limbs and twigs. It couldn’t have been more than 10 meters off the trail. Could this animal have been cached by a cougar? We did not have the answer to that but we were a bit spooked and hurried on our way.
The only live animals we saw were a grouse which we flushed out of some trees and the elk and deer feeding on the steep hills above the canyon. At one point, I caught a glimpse of a brownish mammal scurrying into the trees above the trail. It could have been a rabbit I suppose.
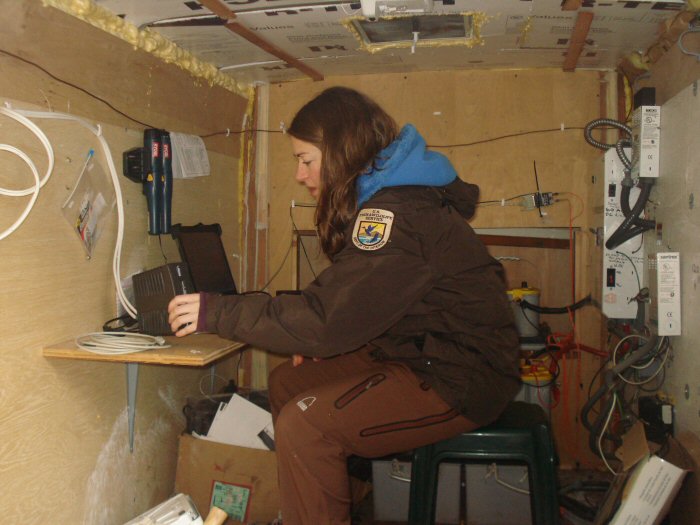
The hike up to the site was gorgeous with the snow covered trees and hillsides and river down below. We arrived at the site and once again, Courtney did her thing. I was very impressed with the equipment running this site. A small trailer housed the PIT tag detector, batteries, and computer and whatever other electronics are needed. Solar panels were perched over the trailer along with a small satellite dish. There were also more than half of a dozen big propane tanks alongside the trailer. Wow!
I later learned that the solar panels will charge the batteries in sunny weather. In the event that they are not working, either in the winter months or extended periods of cloudy days, the propane automatically gets kicked on to take over the charging process. The batteries keep the PIT tag detector and computer running. Data is uploaded via the satellite dish at times. All of this high technology in the middle of nowhere!
After taking a few pictures, downloading data, we shut the site down since those antennas were destroyed with the high flows. We loaded up our gear and headed back down the trail.

We pushed on down the trail since we still had more sites to visit that day. We once again rushed by the site of the elk kill. I for one, did not want to be around if something came back to get a snack. When we reached the snowy part of the trail where we originally saw the wolf tracks, there were some new tracks. A few big cat tracks crossed the trail. Most likely a cougar. Further down the trail we saw smaller cat tracks, maybe those of a bobcat. In addition, there were raccoon and rabbit tracks. All very cool, indeed.
All in all, it was a very good day. Nearly 4 hours of steady hiking, beautiful scenery, and great company. I’d love to do it again.
For more information about this great project, click here.
Submitted by Donna Allard